Python matplotlib通过plt.scatter画空心圆标记出特定的点方法

yipeiwu_com6年前Python基础

在用python画散点图的时候想标记出特定的点,比如在某些点的外围加个空心圆,一样可以通过plt.scatter实现

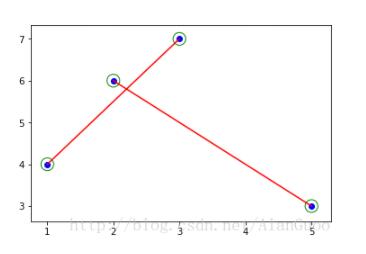
import matplotlib.pyplot as plt

x = [[1, 3], [2, 5]]
y = [[4, 7], [6, 3]]

for i in range(len(x)):

  plt.plot(x[i], y[i], color='r')
  plt.scatter(x[i], y[i], color='b')
  plt.scatter(x[i], y[i], color='', marker='o', edgecolors='g', s=200) # 把 corlor 设置为空,通过edgecolors来控制颜色

效果图

Python matplotlib通过plt.scatter画空心圆标记出特定的点

以上这篇Python matplotlib通过plt.scatter画空心圆标记出特定的点方法就是小编分享给大家的全部内容了,希望能给大家一个参考,也希望大家多多支持【听图阁-专注于Python设计】。

相关文章

Python实现使用dir获取类的方法列表

使用Python的内置方法dir,可以范围一个模块中定义的名字的列表。 官方解释是: Docstring: dir([object]) -> list of strings...

Python 查看list中是否含有某元素的方法

用关键字 in 和not in 来 如下: qwe =[1,2,3,4,5] if 2 in qwe: print ‘good!' else: print ‘not goo...

使用python的pandas为你的股票绘制趋势图

使用python的pandas为你的股票绘制趋势图

前言 手里有一点点公司的股票, 拿不准在什么时机抛售, 程序员也没时间天天盯着看,不如动手写个小程序, 把股票趋势每天早上发到邮箱里,用 python 的 pandas, matplot...

详解用pyecharts Geo实现动态数据热力图城市找不到问题解决

详解用pyecharts Geo实现动态数据热力图城市找不到问题解决

pyecharts 是一个用于生成 Echarts 图表的类库。 Echarts 是百度开源的一个数据可视化 JS 库。主要用于数据可视化。 本文主要是用pycharts中的Geo绘制中...

Python pandas常用函数详解

本文研究的主要是pandas常用函数,具体介绍如下。 1 import语句 import pandas as pd import numpy as np import matplot...