Python+matplotlib+numpy绘制精美的条形统计图
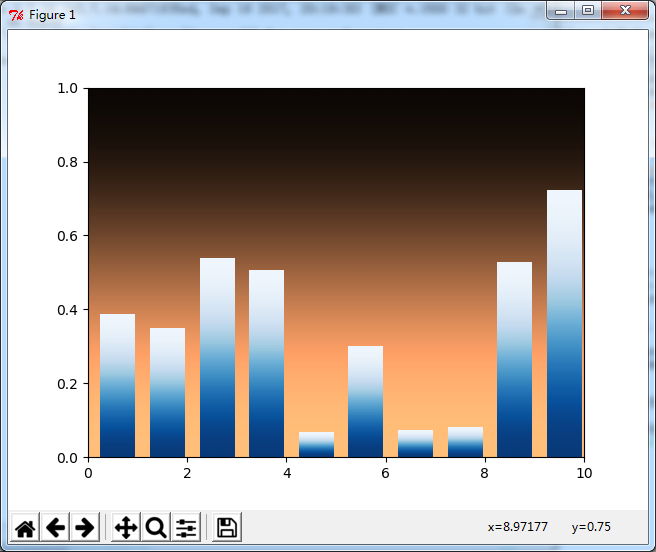
本文实例主要向大家分享了一个Python+matplotlib+numpy绘制精美的条形统计图的代码,效果展示如下:

完整代码如下:
import matplotlib.pyplot as plt
from numpy import arange
from numpy.random import rand


def gbar(ax, x, y, width=0.5, bottom=0):
  X = [[.6, .6], [.7, .7]]
  for left, top in zip(x, y):
    right = left + width
    ax.imshow(X, interpolation='bicubic', cmap=plt.cm.Blues,
         extent=(left, right, bottom, top), alpha=1)


fig = plt.figure()

xmin, xmax = xlim = 0, 10
ymin, ymax = ylim = 0, 1
ax = fig.add_subplot(111, xlim=xlim, ylim=ylim,
           autoscale_on=False)
X = [[.6, .6], [.7, .7]]

ax.imshow(X, interpolation='bicubic', cmap=plt.cm.copper,
     extent=(xmin, xmax, ymin, ymax), alpha=1)

N = 10
x = arange(N) + 0.25
y = rand(N)
gbar(ax, x, y, width=0.7)
ax.set_aspect('auto')
plt.show()
总结
以上就是本文关于Python+matplotlib+numpy绘制精美的条形统计图的全部内容,希望对大家有所帮助。感兴趣的朋友可以继续参阅本站其他相关专题,如有不足之处,欢迎留言指出。感谢朋友们对本站的支持!

