python之matplotlib学习绘制动态更新图实例代码
简介
通过定时器Timer触发事件,定时更新绘图,可以形成动态更新图片。下面的实例是学习《matplotlib for python developers》一文的笔记。
实现
实现代码及简单介绍
通过self.user = self.user[1:] + [temp],每次删除列表的第一元素,在其尾部添加新的元素。这样完成user数据的动态更新。其他详细的解释见文中的注释部分。
#-*-coding:utf-8-*-
import wx
from matplotlib.figure import Figure
import matplotlib.font_manager as font_manager
import numpy as np
from matplotlib.backends.backend_wxagg import \
 FigureCanvasWxAgg as FigureCanvas
# wxWidgets object ID for the timer
TIMER_ID = wx.NewId()
# number of data points
POINTS = 300

class PlotFigure(wx.Frame):
  """Matplotlib wxFrame with animation effect"""
  def __init__(self):
    wx.Frame.__init__(self, None, wx.ID_ANY, title="CPU Usage Monitor", size=(600, 400))
    # Matplotlib Figure
    self.fig = Figure((6, 4), 100)
    # bind the Figure to the backend specific canvas
    self.canvas = FigureCanvas(self, wx.ID_ANY, self.fig)
    # add a subplot
    self.ax = self.fig.add_subplot(111)
    # limit the X and Y axes dimensions
    self.ax.set_ylim([0, 100])
    self.ax.set_xlim([0, POINTS])

    self.ax.set_autoscale_on(False)
    self.ax.set_xticks([])
    # we want a tick every 10 point on Y (101 is to have 10
    self.ax.set_yticks(range(0, 101, 10))
    # disable autoscale, since we don't want the Axes to ad
    # draw a grid (it will be only for Y)
    self.ax.grid(True)
    # generates first "empty" plots
    self.user = [None] * POINTS
    self.l_user,=self.ax.plot(range(POINTS),self.user,label='User %')

    # add the legend
    self.ax.legend(loc='upper center',
              ncol=4,
              prop=font_manager.FontProperties(size=10))
    # force a draw on the canvas()
    # trick to show the grid and the legend
    self.canvas.draw()
    # save the clean background - everything but the line
    # is drawn and saved in the pixel buffer background
    self.bg = self.canvas.copy_from_bbox(self.ax.bbox)
    # bind events coming from timer with id = TIMER_ID
    # to the onTimer callback function
    wx.EVT_TIMER(self, TIMER_ID, self.onTimer)

  def onTimer(self, evt):
    """callback function for timer events"""
    # restore the clean background, saved at the beginning
    self.canvas.restore_region(self.bg)
        # update the data
    temp =np.random.randint(10,80)
    self.user = self.user[1:] + [temp]
    # update the plot
    self.l_user.set_ydata(self.user)
    # just draw the "animated" objects
    self.ax.draw_artist(self.l_user)# It is used to efficiently update Axes data (axis ticks, labels, etc are not updated)
    self.canvas.blit(self.ax.bbox)
if __name__ == '__main__':
  app = wx.PySimpleApp()
  frame = PlotFigure()
  t = wx.Timer(frame, TIMER_ID)
  t.Start(50)
  frame.Show()
  app.MainLoop()
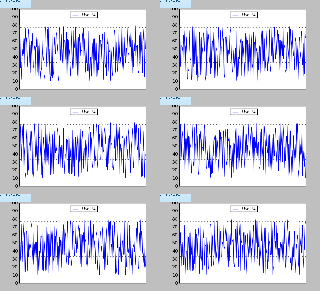
运行结果如下所示:
疑问
但程序运行在关闭的时候会出现应用程序错误,不知道什么问题。python不是有垃圾回收机制吗,难道是内存泄露?
猜测的原因可能是在关闭的时候正在绘图故导致应用程序出错。通过添加Frame的析构函数,停止更新则不会出现问题。
def __del__( self ):
  t.Stop()
总结
以上就是本文关于python之matplotlib学习绘制动态更新图实例代码的全部内容,希望对大家有所帮助。感兴趣的朋友可以继续参阅本站其他相关专题,如有不足之处,欢迎留言指出。感谢朋友们对本站的支持!