使用matplotlib中scatter方法画散点图
本文实例为大家分享了用matplotlib中scatter方法画散点图的具体代码,供大家参考,具体内容如下
1、最简单的绘制方式
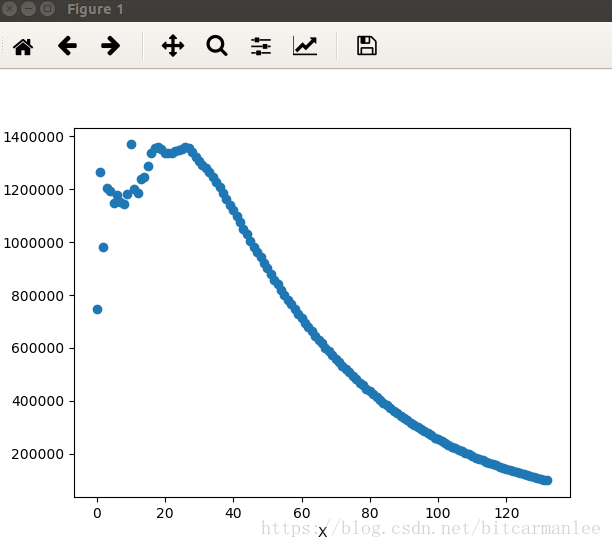
绘制散点图是数据分析过程中的常见需求。python中最有名的画图工具是matplotlib,matplotlib中的scatter方法可以方便实现画散点图的需求。下面我们来绘制一个最简单的散点图。
数据格式如下:
0 746403
1 1263043
2 982360
3 1202602
...
其中第一列为X坐标,第二列为Y坐标。下面我们来画图。
#!/usr/bin/env python
#coding:utf-8

import matplotlib.pyplot as plt

def pltpicture():
 file = "xxx"
 xlist = []
 ylist = []
 with open(file, "r") as f:
  for line in f.readlines():
   lines = line.strip().split()
   if len(lines) != 2 or int(lines[1]) < 100000:
    continue
   x, y = int(lines[0]), int(lines[1])
   xlist.append(x)
   ylist.append(y)

 plt.xlabel('X')
 plt.ylabel('Y')
 plt.scatter(xlist, ylist)
 plt.show()
2、更漂亮一些的画图方式
上面的图片比较粗糙,是最简单的方式,没有任何相关的配置项。下面我们再用另外一份数据集画出更漂亮一点的图。
数据集来自网络的公开数据集,数据格式如下:
40920 8.326976 0.953952 3
14488 7.153469 1.673904 2
26052 1.441871 0.805124 1
75136 13.147394 0.428964 1
...
第一列每年获得的飞行常客里程数;
第二列玩视频游戏所耗时间百分比;
第三列每周消费的冰淇淋公升数;
第四列为label:
1表示不喜欢的人
2表示魅力一般的人
3表示极具魅力的人
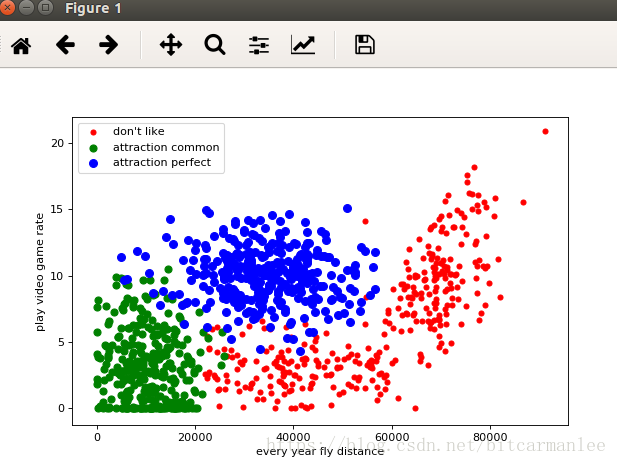
现在将每年获取的飞行里程数作为X坐标,玩视频游戏所消耗的事件百分比作为Y坐标,画出图。
from matplotlib import pyplot as plt

file = "/home/mi/wanglei/data/datingTestSet2.txt"
label1X, label1Y, label2X, label2Y, label3X, label3Y = [], [], [], [], [], []

with open(file, "r") as f:
 for line in f:
  lines = line.strip().split()
  if len(lines) != 4:
   continue
  distance, rate, label = lines[0], lines[1], lines[3]
  if label == "1":
   label1X.append(distance)
   label1Y.append(rate)

  elif label == "2":
   label2X.append(distance)
   label2Y.append(rate)

  elif label == "3":
   label3X.append(distance)
   label3Y.append(rate)

plt.figure(figsize=(8, 5), dpi=80)
axes = plt.subplot(111)

label1 = axes.scatter(label1X, label1Y, s=20, c="red")
label2 = axes.scatter(label2X, label2Y, s=40, c="green")
label3 = axes.scatter(label3X, label3Y, s=50, c="blue")

plt.xlabel("every year fly distance")
plt.ylabel("play video game rate")
axes.legend((label1, label2, label3), ("don't like", "attraction common", "attraction perfect"), loc=2)

plt.show()
最后效果图:
3、scatter函数详解
我们来看看scatter函数的签名:
def scatter(self, x, y, s=None, c=None, marker=None, cmap=None, norm=None,
    vmin=None, vmax=None, alpha=None, linewidths=None,
    verts=None, edgecolors=None,
    **kwargs):
  """
  Make a scatter plot of `x` vs `y`

  Marker size is scaled by `s` and marker color is mapped to `c`

  Parameters
  ----------
  x, y : array_like, shape (n, )
   Input data

  s : scalar or array_like, shape (n, ), optional
   size in points^2. Default is `rcParams['lines.markersize'] ** 2`.

  c : color, sequence, or sequence of color, optional, default: 'b'
   `c` can be a single color format string, or a sequence of color
   specifications of length `N`, or a sequence of `N` numbers to be
   mapped to colors using the `cmap` and `norm` specified via kwargs
   (see below). Note that `c` should not be a single numeric RGB or
   RGBA sequence because that is indistinguishable from an array of
   values to be colormapped. `c` can be a 2-D array in which the
   rows are RGB or RGBA, however, including the case of a single
   row to specify the same color for all points.

  marker : `~matplotlib.markers.MarkerStyle`, optional, default: 'o'
   See `~matplotlib.markers` for more information on the different
   styles of markers scatter supports. `marker` can be either
   an instance of the class or the text shorthand for a particular
   marker.

  cmap : `~matplotlib.colors.Colormap`, optional, default: None
   A `~matplotlib.colors.Colormap` instance or registered name.
   `cmap` is only used if `c` is an array of floats. If None,
   defaults to rc `image.cmap`.

  norm : `~matplotlib.colors.Normalize`, optional, default: None
   A `~matplotlib.colors.Normalize` instance is used to scale
   luminance data to 0, 1. `norm` is only used if `c` is an array of
   floats. If `None`, use the default :func:`normalize`.

  vmin, vmax : scalar, optional, default: None
   `vmin` and `vmax` are used in conjunction with `norm` to normalize
   luminance data. If either are `None`, the min and max of the
   color array is used. Note if you pass a `norm` instance, your
   settings for `vmin` and `vmax` will be ignored.

  alpha : scalar, optional, default: None
   The alpha blending value, between 0 (transparent) and 1 (opaque)

  linewidths : scalar or array_like, optional, default: None
   If None, defaults to (lines.linewidth,).

  verts : sequence of (x, y), optional
   If `marker` is None, these vertices will be used to
   construct the marker. The center of the marker is located
   at (0,0) in normalized units. The overall marker is rescaled
   by ``s``.

  edgecolors : color or sequence of color, optional, default: None
   If None, defaults to 'face'

   If 'face', the edge color will always be the same as
   the face color.

   If it is 'none', the patch boundary will not
   be drawn.

   For non-filled markers, the `edgecolors` kwarg
   is ignored and forced to 'face' internally.

  Returns
  -------
  paths : `~matplotlib.collections.PathCollection`

  Other parameters
  ----------------
  kwargs : `~matplotlib.collections.Collection` properties

  See Also
  --------
  plot : to plot scatter plots when markers are identical in size and
   color

  Notes
  -----

  * The `plot` function will be faster for scatterplots where markers
   don't vary in size or color.

  * Any or all of `x`, `y`, `s`, and `c` may be masked arrays, in which
   case all masks will be combined and only unmasked points will be
   plotted.

   Fundamentally, scatter works with 1-D arrays; `x`, `y`, `s`, and `c`
   may be input as 2-D arrays, but within scatter they will be
   flattened. The exception is `c`, which will be flattened only if its
   size matches the size of `x` and `y`.

  Examples
  --------
  .. plot:: mpl_examples/shapes_and_collections/scatter_demo.py

  """
其中具体的参数含义如下:
x,y是相同长度的数组。
s可以是标量,或者与x,y长度相同的数组,表明散点的大小。默认为20。
c即color,表示点的颜色。
marker 是散点的形状。
以上就是本文的全部内容,希望对大家的学习有所帮助,也希望大家多多支持【听图阁-专注于Python设计】。