python调用Matplotlib绘制分布点图
Python调用Matplotlib代码绘制分布点,供大家参考,具体内容如下
- 绘制点图的目的
- Matplotlib简介
- 代码
- 截图
1.绘制点图的目的
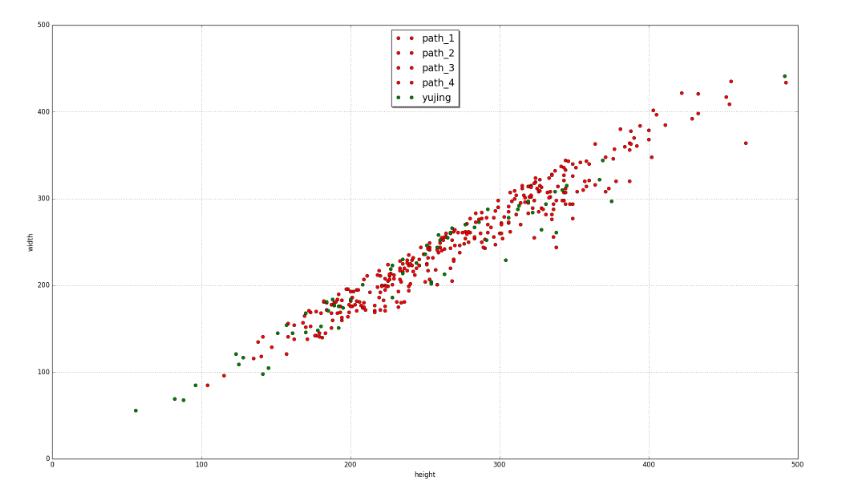
我们实验室正在做关于人脸识别的项目,其中在人脸检测后,会有些误检的图片,但是其中就有很多不符合的。很明显的是从图片大小,就可以过滤掉一部分。老大交给我的工作,就是通过绘制图片width,height的分布图,来找到一个合理的阈值。
2.Matlablib简介
Matplotlib是一个Python的图形框架
下面是官网的例子
3.代码如下
import matplotlib.pyplot as plt
from numpy.random import rand
import numpy
import os
import cv2

#setting plt
plt.xlim(xmax=500,xmin=0)
plt.ylim(ymax=500,ymin=0)
plt.xlabel("height")
plt.ylabel("width")


path_1 = r'D:\zhangjichao\view\path_1'


x = []
y = []
files = os.listdir(path_1)
for f in files:
  img = cv2.imread(path_1 + '\\' + f)
  x.append(img.shape[0])
  y.append(img.shape[1])
plt.plot(x,y,'ro',color='red',label='path_1')

path_2 = r'D:\zhangjichao\view\path_2'

x = []
y = []
files = os.listdir(path_2)
for f in files:
  img = cv2.imread(path_2 + '\\' + f)
  x.append(img.shape[0])
  y.append(img.shape[1])
plt.plot(x,y,'ro',color='red',label='path_2')

path_3 = r'D:\zhangjichao\view\path_3'


x = []
y = []
files = os.listdir(path_3)
for f in files:
  img = cv2.imread(path_3 + '\\' + f)
  x.append(img.shape[0])
  y.append(img.shape[1])
plt.plot(x,y,'ro',color='red',label='path_3')

path_4 = r'D:\zhangjichao\view\path_4'

x = []
y = []
files = os.listdir(path_4)
for f in files:
  img = cv2.imread(path_4 + '\\' + f)
  x.append(img.shape[0])
  y.append(img.shape[1])
plt.plot(x,y,'ro',color='red',label='path_4')

yujing = r'D:\zhangjichao\view\xujing'

x = []
y = []
files = os.listdir(yujing)
for f in files:
  img = cv2.imread(yujing + '\\' + f)
  x.append(img.shape[0])
  y.append(img.shape[1])
plt.plot(x,y,'ro',color='green' , label='yujing')

#图例
plt.legend(loc='upper center', shadow=True, fontsize='x-large')
plt.grid(True)

#显示
plt.show()
4.显示结果
以上就是本文的全部内容,希望对大家的学习有所帮助,也希望大家多多支持【听图阁-专注于Python设计】。