python 画3维轨迹图并进行比较的实例
一. 数据的格式
首先我们需要x,y,z三个数据进行画图。从本实验用到的数据集KITTI 00.txt中举例:
1.000000e+00 9.043680e-12 2.326809e-11 5.551115e-17 9.043683e-12 1.000000e+00 2.392370e-10 3.330669e-16 2.326810e-11 2.392370e-10 9.999999e-01 -4.440892e-16
一组有12个数据,相当于T={R,t},R是3×3的矩阵,t是3×1的矩阵。我们需要的是t的数据。
有些groundtruth是8个数据,第一个是时间戳,在三个是x,y,z,后面四个是是四元数的数据。
代码如下:
# import necessary module
from mpl_toolkits.mplot3d import axes3d
import matplotlib.pyplot as plt
import numpy as np

# load data from file
# you can replace this using with open
data1 = np.loadtxt("./dataset/poses/00.txt")

first_2000 = data1[:, 3]
second_2000 = data1[:, 7]
third_2000 = data1[:, 11]
data2 = np.loadtxt("../temp/kittiseq00_imu.txt")
first_1000 = data2[:, 1]
second_1000 = data2[:, 2]
third_1000 = data2[:, 3]
# print to check data
#print first_2000
#print second_2000
#print third_2000

# new a figure and set it into 3d
fig = plt.figure()
ax = fig.gca(projection='3d')

# set figure information
ax.set_title("3D_Curve")
ax.set_xlabel("x")
ax.set_ylabel("y")
ax.set_zlabel("z")

# draw the figure, the color is r = read
figure1 = ax.plot(first_2000, second_2000, third_2000, c='r')
figure2 = ax.plot(first_1000, second_1000, third_1000, c='b')
plt.show()
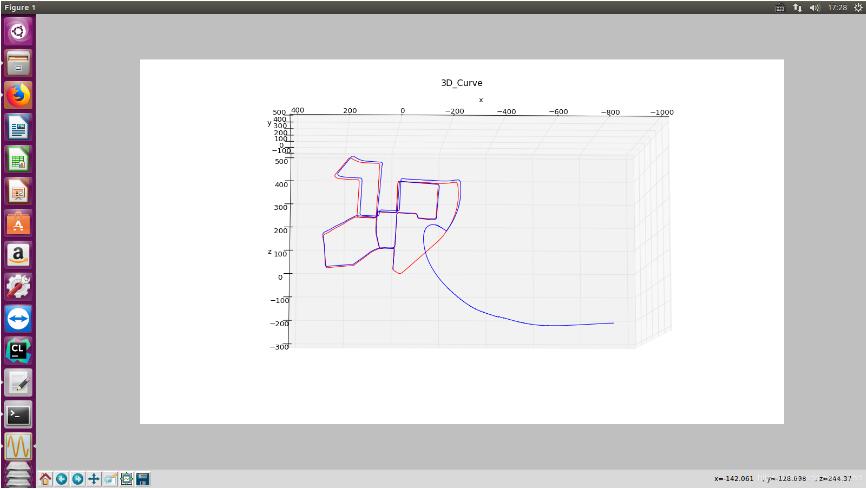
效果图(电脑比较垃圾,后面的轨迹跟踪的时候提取的特征点太少):
以上这篇python 画3维轨迹图并进行比较的实例就是小编分享给大家的全部内容了,希望能给大家一个参考,也希望大家多多支持【听图阁-专注于Python设计】。