python绘制地震散点图
本项目是利用五年左右的世界地震数据,通过python的pandas库、matplotlib库、basemap库等进行数据可视化,绘制出地震散点图。主要代码如下所示
from __future__ import division
import pandas as pd
from pandas import Series,DataFrame
import numpy as np
from matplotlib.patches import Polygon

chi_provinces = ['北京','天津','上海','重庆',
     '河北','山西','辽宁','吉林',
     '黑龙江','江苏','浙江','安徽',
     '福建','江西','山东','河南',
     '湖北','湖南','广东','海南',
     '四川','贵州','云南','陕西',
     '甘肃','青海','台湾','内蒙古',
     '广西','西藏','宁夏','新疆',
     '香港','澳门'] #list of chinese provinces


def is_in_china(str):
 if str[:2] in chi_provinces:
  return True
 else:
  return False

def convert_data_2014(x):
 try:
  return float(x.strip())
 except ValueError:
  return x
 except AttributeError:
  return x

def format_lat_lon(x):
 try:
  return x/100
 except(TypeError):
  return np.nan

df = pd.read_excel(r'C:/Users/GGWS/Desktop/shuju/201601-12.xls')
df = df.append(pd.read_excel(r'C:/Users/GGWS/Desktop/shuju/201201-12.xls'),ignore_index = True)
df = df.append(pd.read_excel(r'C:/Users/GGWS/Desktop/shuju/shuju.xls'),ignore_index = True)
df = df.append(pd.read_excel(r'C:/Users/GGWS/Desktop/shuju/201501-12.xls'),ignore_index = True)
df_2014 = pd.read_excel(r'C:/Users/GGWS/Desktop/shuju/201401-12.xls') #have to introduce statics of 2014 independently because the format and the type of data of specific column in this data set are different from others
df['longitude'] = df['longitude'].apply(convert_data_2014)
df['latitude'] = df['latitude'].apply(convert_data_2014)

df_2014['longitude'] = df_2014['longitude'].apply(convert_data_2014)
df_2014['latitude'] = df_2014['latitude'].apply(convert_data_2014)
df = df.append(df_2014,ignore_index = True)

df = df[['latitude','longitude','magnitude','referenced place','time']] #only save four columns as valuable statics

df[['longitude','latitude']] = df[['longitude','latitude']].applymap(format_lat_lon) #use function "applymap" to convert the format of the longitude and latitude statics
df = df.dropna(axis=0,how='any') #drop all rows that have any NaN values
format_magnitude = lambda x: float(str(x).strip('ML'))
df['magnitude'] = df['magnitude'].apply(format_magnitude)
#df = df[df['referenced place'].apply(is_in_china)]

lon_mean = (df['longitude'].groupby(df['referenced place'])).mean()
lat_mean = (df['latitude'].groupby(df['referenced place'])).mean()
group_counts = (df['magnitude'].groupby(df['referenced place'])).count()
after_agg_data = pd.concat([lon_mean,lat_mean,group_counts], axis = 1 )
after_agg_data.rename(columns = {'magnitude':'counts'} , inplace = True)
 #aggregate after grouping the data

after_sorted_data = after_agg_data.sort_values(by = 'counts',ascending = False)
new_index = np.arange(len(after_sorted_data.index))
after_sorted_data.index = new_index
paint_data = after_sorted_data[after_sorted_data['counts']>=after_sorted_data['counts'][80]]


import matplotlib.pyplot as plt
from mpl_toolkits.basemap import Basemap

plt.figure(figsize=(16,8))
m = Basemap()
m.readshapefile(r'C:/Users/GGWS/Desktop/jb/gadm36_CHN_1', 'states', drawbounds=True)
ax = plt.gca()
'''
for nshape,seg in enumerate (m.states):
 poly = Polygon(seg,facecolor = 'r')
 ax.add_patch(poly)
'''
m.drawcoastlines(linewidth=0.5)
m.drawcountries(linewidth=0.5)
m.shadedrelief()


for indexs in df.index:
  lon2,lat2 = df.loc[indexs].values[1],df.loc[indexs].values[0]
  x,y = m(lon2,lat2)
  m.plot(x,y,'ro',markersize = 0.5)      #获取经度值
'''
for indexs in after_sorted_data.index[:80]:
 lon,lat = after_sorted_data.loc[indexs].values[0],after_sorted_data.loc[indexs].values[1]
 x,y = m(lon,lat)
 m.plot(x,y,'wo',markersize = 10*(after_sorted_data.loc[indexs].values[2]/after_sorted_data.loc[0].values[2]))
'''
plt.title("Worldwide Earthquake")
plt.show()

#indexs-len(df.index)+80
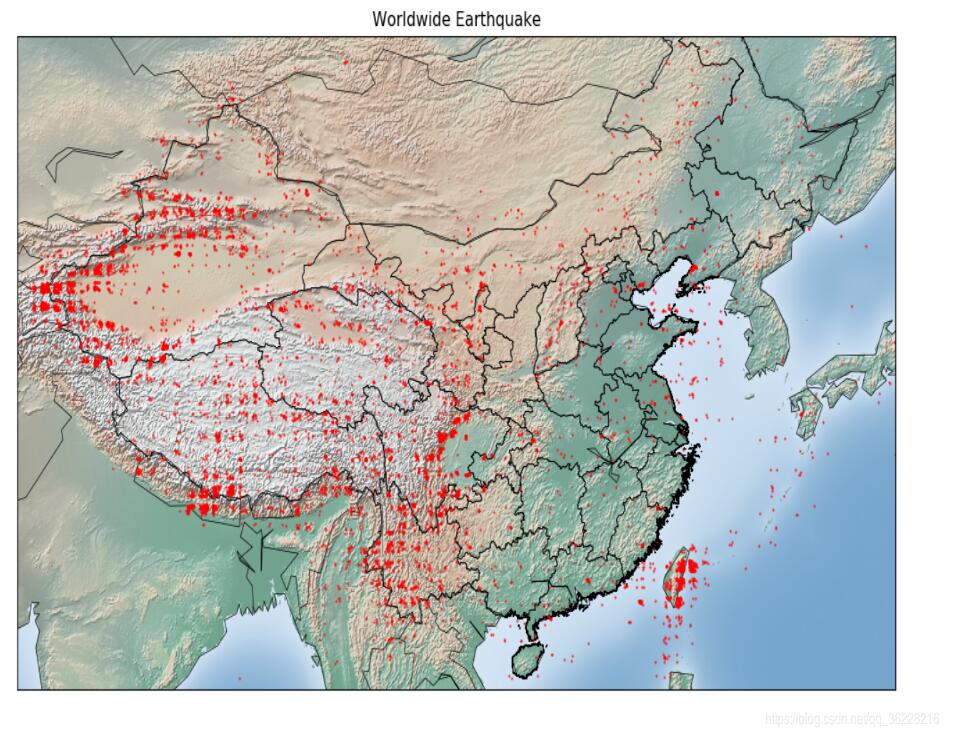
效果如下
以上就是本文的全部内容,希望对大家的学习有所帮助,也希望大家多多支持【听图阁-专注于Python设计】。